Petrol prices always seem to be in the news. This is mostly because it costs a lot of money and continues to increase all the time. Duty increases and VAT increases are both usually blamed. Also the price of crude oil is often blamed. This made me wonder if there was an actual correlation between crude oil and petrol at the pump. I did a little searching but did not find anything solid. In fact the graphs I did find were particularly bad, including one graph that plotted crude oil and petrol using different scales on the same graph. Some did produce vaguely interesting graphs but few provide their sources and none provided the raw source data.
I decided to take matters into my own hands and do some data analysis on the raw data. Getting hold of this data actually proved to be quite difficult. After quite a bit of searching I eventually found historical prices of Brent Crude Oil on the US Energy Information Administration website. I found historical UK fuel prices on the UK Department of Energy and Climate Change. I even found historical exchange rates on Oanda.
Currently I drive a petrol-fueled car so I concentrated on petrol and discarded diesel. I expect diesel prices are quite similar. The crude oil and petrol figures I obtained were weekly averages. I decided to use Excel to do most of my analysis, this is mostly because I’m more familiar with it and did not want to learn another package at the same time. I had just under 8 years of data to work with. I first worked on the petrol figures, I deducted the VAT rate at the time and then deducted the petrol duty amount at the time, both of which were helpfully included in the data. I then worked out the monthly average for both sets of figures. I did this because the dates for crude oil and petrol did not match up. I used the historical exchange rates to calculate the price of Brent crude oil in pounds (it is usually quoted in US Dollars). I was then able to plot the petrol price against the Brent crude for each month for the past 8 years. After quite some time battling with Excel I managed to produce something that is not too far from what I wanted.
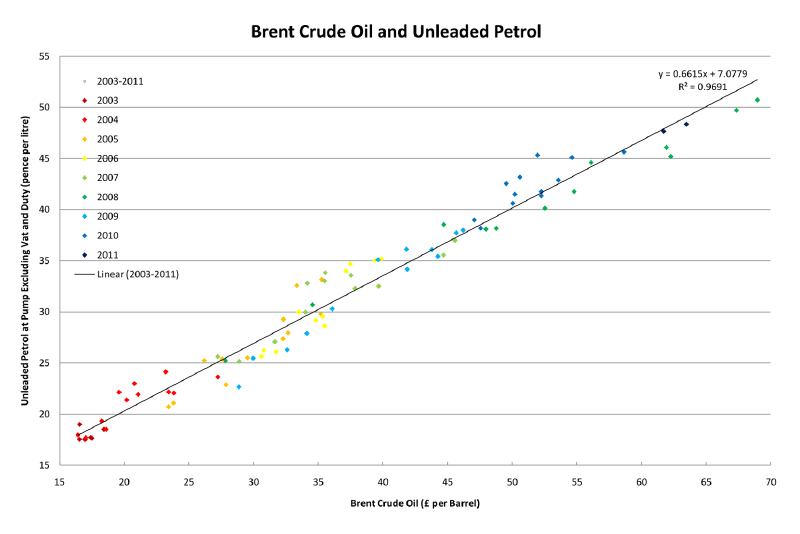
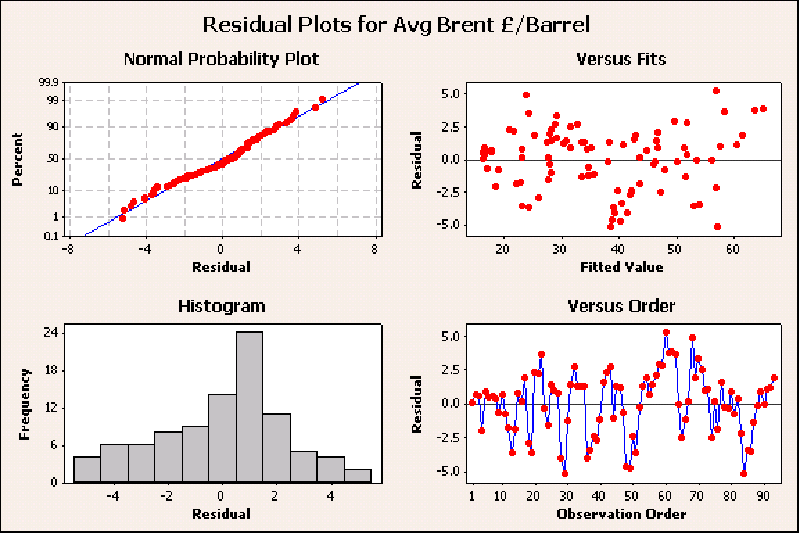
As you can see, this produces quite a positive correlation; this actually surprised me. Linear regression calculated R^2^ as 0.9691. It was at this point that I started hitting problems with Excel’s data analysis as well as my own statistical knowledge. Excel’s regression add-in in the data analysis pack was able to produce some figures, but I did not find them very useful. I then turned to my friendly local statistician. She loaded all my data into minitab. This turned out to be quite a cool program allowing the user to quickly analyze the data. It produced the same regression equation as Excel. It also produced many more numbers as well as 4 little residual plots that look quite pretty.
Minitab then calculated a prediction point for a Brent crude oil value of £71.7, i.e. the current price of a barrel of Brent crude oil is $115 (on 11/03/2011). It was able to calculate confidence and prediction intervals. It can predict future values of fuel based on the Brent crude oil price. If Brent crude oil stays at the current price of $115 per barrel and duty and VAT are added back on it gives the price of petrol at the pump at 136.14 +-3.92 ppl. This is interesting as the lower prediction is 132.22 which is fairly close to today’s current price (11/03/2011).
I also drew up a quick plot projecting the petrol price if the price of Brent crude oil continues to rise by another 50p
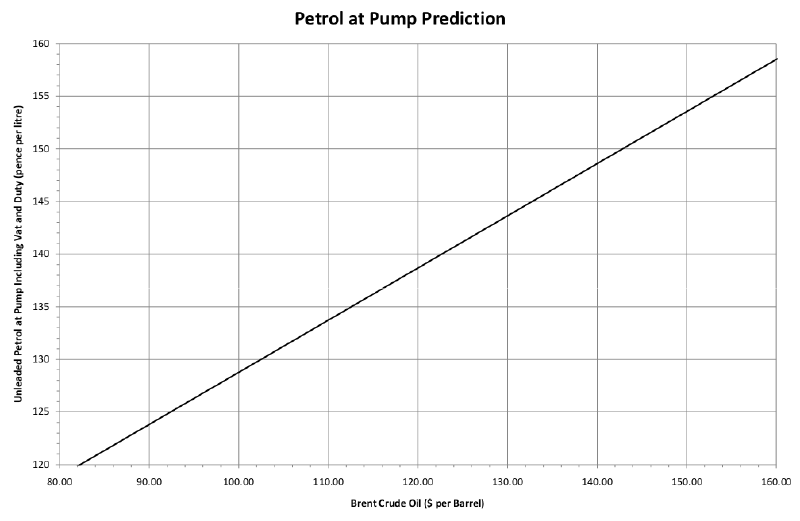
The generic formula is: Unleaded Petrol at Pump = ((7.08+(b/u)*0.661)+d)*v. Where b is the Price of Brent Crude oil, u is the USD2GBP rate, d is the duty and v is the VAT. The above graph uses this: ((7.08+(Brent Crude/1.60129)*0.661)+58.95)*1.2.
I have more ideas for analysis. I wanted to try to calculate the lag between crude oil price changes and petrol prices but I’m not really sure this is possible with the current data. Plus I don’t have any idea how to do this. I did graph duty against time, interestingly this was quite linear even though duty up to now was supposed to be tracking inflation, however fuel affects inflation so I’m not so sure.
I’ve also got a copy of the spreadsheet I used for my analysis: oil20110312.xlsx, sorry it’s in Open XML. It’s released under the Creative Commons Attribution-NonCommercial-ShareAlike 3.0 Unported License..